Rise in sea level
Dr John Hunter (oceanographer and University of Tasmania Associate).
There is still much speculation about sea level rise. This article explores the data, techniques to assess, and the projected rise in sea level in Australia.
Most people expect that sea levels will rise due to ice sheets and glaciers melting at the poles, and they are right. However, a significant component of rising sea levels (around 57 per cent since 1993) is due to thermal expansion of water. Thermal expansion describes how as water warms, it has a greater volume than the same amount of cool water. Therefore sea level is expected to rise faster in warmer regions, such as the east coast of Australia.
One of the oldest sea level benchmarks in the southern hemisphere can be found in Tasmania, etched into the rocks on the Isle of the Dead, Port Arthur. The benchmark provided some of the first sea level records taken by local storekeeper (and clearly a budding scientist) T.J Lempriere and a visiting captain, James Ross.
It is amazing that such a simple action has enabled scientists to make accurate sea level rise calculations more than 150 years later. One such scientist, oceanographer Dr John Hunter, pictured left, has used this historical tide data to determine the relative sea level rise off the coast of Port Arthur, Tasmania.
By using the benchmark records and more recent information, Dr Hunter calculated that from 1841 to 2002 sea level rise due to increased ocean volume was approximately 17cm at Port Arthur. That’s an increase of 1.0mm (±0.3mm) a year due to thermal expansion (and taking into account land uplift). Modern techniques used to gather sea level data include permanent tidal gauges (Permanent Service for Mean Sea Level PSMSL) and satellite altimeters. Satellite altimeters measure heights, and in the case of sea level the altimeters measure a radar pulse from the satellite to the sea surface and back again. They provide the most recent sea level data, only in operation since 1992.
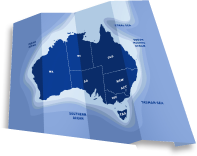
In Australia the National Tide Centre (NTC) has 14 permanent tidal gauges or SEAFRAME (SEA-Level Fine Resolution Acoustic Measuring Equipment) stations across Australia. These gauges are sensitive enough to measure the small and gradual changes which scientists predict are occurring as a result of global warming. Every hour sea level data is collected by the NTC and summarised in monthly reports for the Australian Baseline Sea Level Monitoring Project.
Projected Sea Level Rise
There is still much debate and speculation about projected sea level rise. This is because the effects of large-scale melting of polar caps, glacier and icesheets would be considerable, and yet relatively unknown. It’s just not well known how much melt will enter the ocean.
The Intergovernmental Panel on Climate Change (IPCC) states projections of global sea level rise show an increase in sea levels, relative to 1990 levels, of between 18 and 59 cm by 2095. However there are provisions for larger values with the potential increased ice melt from Greenland and Antarctica, in which case the projections increase by a further 10 to 20 cm.
Increased sea levels will greatly impact upon low lying regions including islands, beaches and wetlands. A rough guide suggests that, as a rule of thumb, a 1cm rise in sea level could result in the loss of 1 meter of beach.
Impacts of sea level rise include loss of sandy beaches and beach habitats, and more coastal erosion, damage to coastal properties, and increased flooding during storm events.
Want to know more about sea level rise and our oceans? Check out these links:
Sea-Level Rise Report Card at: http://www.acecrc.org.au/access/repository/resource/1c91bb6a-15f5-1030-998b-40404adc5e91/ACE%20SLR%20REPORT%20CARD.pdf
The CSIRO Sea Level Rise website
The National Tidal Centre (NTC) website with reports of sea level readings from tidal gauge facilities across Australia
Climate Change and Australia’s coast communities CSIRO Department of Climate Change web site
Tasmanian shoreline monitoring and archiving project (TASMARC) and the The National Tidal Centre (NTC)
Sources:
Church, J.A., J.R. Hunter, K.L. McInnes and N.J. White (2006), sea level rise around the Australian coastline and the changing frequency of extreme sea level events. Australian Meteorological Magazine, 55, 253-260
Hunter, J.,R. Coleman, and D. Pugh, The Sea Level at Port Arthur, Tasmania, from 1841 to the Present, Geophys. Res. Lett., 30(7), 1401, doi:10.1029/2002GL016813, 2003.
IPCC (2007) Climate change 2007: impacts, adaptation, and vulnerability. Working group II contribution to the intergovernmental panel on climate change fourth assessment report. IPCC Secretariat, Geneva.
Sharples, C., 2006: Indicative Mapping of Tasmanian Coastal Vulnerability to Climate Change and Sea-Level Rise: Explanatory Report (Second Edition); Consultant Report to Department of Primary Industries & Water.
John Hunter is an oceanographer and University of Tasmania Associate.


