Redmap data: Top 10 sightings and other trends
Yvette Barry, 14 Oct 2014.
Australian divers, fishers, and beachcombers have reported 1060+ sightings on Redmap. Nearly 30 per cent of the confirmed sightings were considered uncommon where spotted, i.e. they were out of their known range. Here are the latest trends from the Redmap data...
The Top 10 species logged on Redmap Australia since 2009:
1. Sagmariasus verreauxi (Eastern rock lobster)
2. Girella zebra (Zebrafish)
3. Seriola lalandi (Yellowtail kingfish)
4. Parma microlepis (White-ear)
5. Olisthops cyanomelas (Herring cale)
6. Stethojulis interrupta (Brokenline wrasse)
7. Girella tricuspidata (Luderick)
8. Enoplosus armatus (Old wife)
9. Zanclus cornutus (Moorish idol)
10. Pagrus auratus (Snapper)
Most of Redmap's Top 10 sightings were spotted in Tasmanian waters (except Brokenline wrasse and Moorish Idol); and these species were often seen further south than their known geographic range.
Tasmania's dominance within the data makes sense for two reasons. First, the project began in Tasmania in 2009 and only went national at the end of 2012. So more sightings were collected in Tasmania over this time. Second, Tasmania's east coast is a global warming hot spot, with seas warming at 3-4 times the global average. Tasmania is experiencing more obvious changes in the distribution of marine life as species extend ranges south in search of their preferred climate. Tasmanian divers and fishers are therefore more likely to come across an 'uncommon' species than say in Queensland, where changes in water temperatures are not so marked.
The most reported species per state
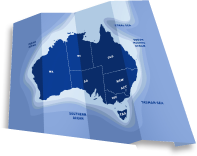
The most reported species in each state is shown in the table below and explained in the pictures at the end of this article:

State rivalry
Tasmanians logged the most sightings for Redmap (as explained above). New South Wales follows in the sightings race, where warm-water species were mainly logged by an enthusiastic diving community!

How far from ''home" are species shifting south?
Redmap needs more long-term data to work out the distance that each species, on average, may be shifting from their known or usual range. But to give you an idea, here are some individual sightings and how far south they were spotted from their known range:

How was Redmap's community data collected?
Nearly 60 per cent of Redmap sightings were spotted during a dive, followed by fishing (31%), beach combing (7%) and the rest while boating and swimming.

Keep your sightings coming!
If Australian seas continue to warm, we expect more species to shift their geographic ranges further south in search of their preferred temperatures and conditions. But Redmap needs more community sightings over a longer period of time to be able to map which marine species are on the move and to where. Redmap data gives an early indication of changes in marine systems.This information will help scientists and fishing industries to direct their research to those areas and species most impacted by climate change and range shifts.
We can't monitor such a vast coastline without your help - so keep logging sightings on the REDMAP app and website and contribute to marine science!
PHOTOS BELOW: MOST LOGGED SPECIES PER STATE
SOUTH AUSTRALIA did not have a 'most sighted' species - it only has one individual sighted of each species! But we added the giant cuttlefish (Sepia apama) here as it's a Redmap species of interest. Giant cuttlefish occur across southern Australia but aggregate to breed near Point Lowly, in the Spencer Gulf, SA. This is the only known breeding aggregation in the world for this species. Numbers have declined in recent years and we're not sure why. We need more sightings to assess its distribution (Photo: Andy Burnell).


